Introduction: The ROI Question Nobody Is Asking Correctly
There is a conversation that plays out in almost every lab that is thinking about getting a LIMS. Someone from the lab side makes the case. They talk about faster reporting, fewer errors, better compliance. The finance team listens politely, then asks the question that ends many LIMS projects before they ever begin: "What's the return on investment?"
And that is where things get complicated.
Most labs respond to this question by pulling together a list of direct costs — hours saved on manual data entry, paper reduced, overtime eliminated. They build a spreadsheet. It looks reasonable. Sometimes it is even compelling.
But here is the problem: that spreadsheet captures maybe 30% of the actual value a LIMS delivers.
The other 70%? It is sitting in categories that nobody thought to measure. Compliance penalties avoided. Repeat tests that no longer happen. Clients who stay because you consistently deliver on time. Audits that go smoothly instead of turning into three-week emergencies. Scientists who do not quit because they are tired of entering the same data four different ways.
We are going to walk through every dimension of LIMS ROI — the obvious ones and the ones that rarely make it into a budget proposal. By the end, you will have a framework you can actually use to calculate the full value of a LIMS investment and make a case that goes beyond a cost-reduction argument.
Because the truth is, the labs that get the most from their LIMS investments are not the ones who bought a cheaper system. They are the ones who understood what they were really buying.
What Most Labs Get Wrong About LIMS ROI
Before getting into the numbers, it helps to understand why so many LIMS ROI calculations come up short.
The most common mistake is treating LIMS as a cost centre rather than a revenue enabler. When you frame the question as "how much does it cost versus how much does it save," you have already limited your analysis to operational efficiency. That is a fine starting point. It is a terrible ending point.
The second mistake is comparing the wrong things. A lot of labs calculate ROI by asking: "What did we spend before on manual processes?" Then they subtract the LIMS subscription or licence fee and call the difference their return. But that ignores what happens when the lab can suddenly handle 30% more samples with the same headcount. Or when a pharmaceutical client awards a long-term contract because you passed a GMP audit they expected you to fail. Those are not cost savings. Those are revenue outcomes, and they belong in the same conversation.
The third mistake — and this one is surprisingly common — is calculating ROI at the point of purchase instead of over a realistic time horizon. A LIMS implementation does not deliver its full value in month one. It builds. The efficiency gains compound. The compliance infrastructure pays off when an audit happens. The data quality improvements start producing better decisions six months in, twelve months in, two years in.
When you factor in all three of these dimensions — operational savings, revenue impact, and compounding value over time — the ROI picture for a well-implemented LIMS looks dramatically different from the initial cost-reduction estimate.
The Hidden Costs of NOT Having a LIMS
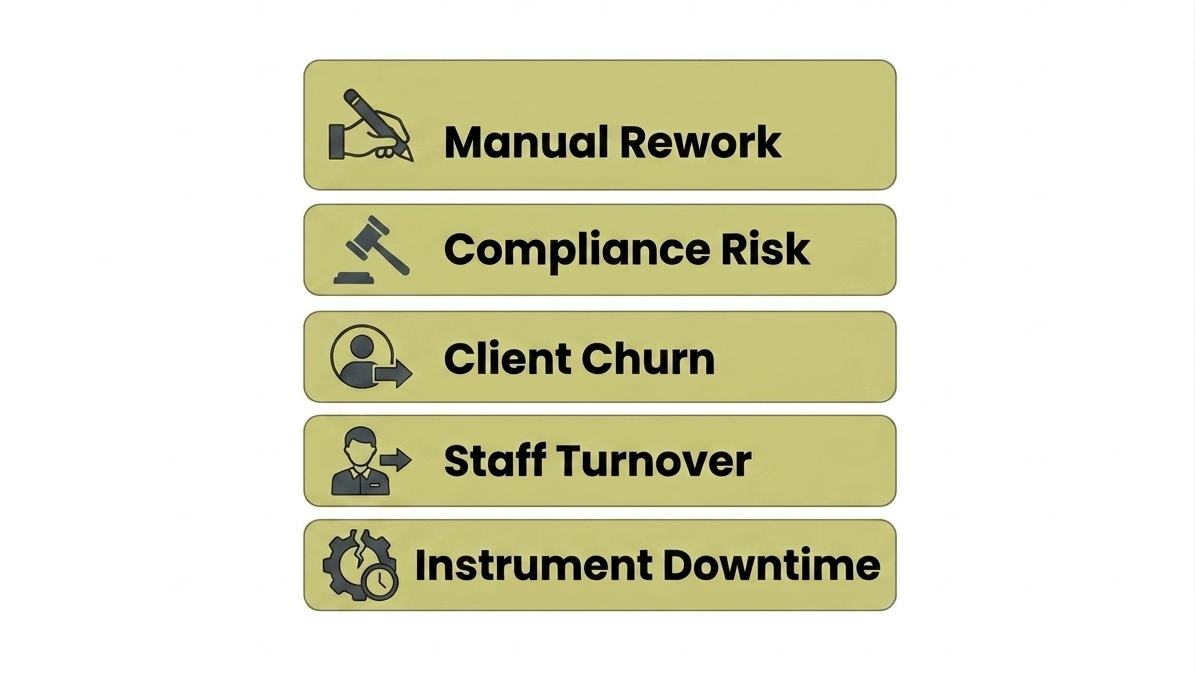
Any honest ROI calculation has to start here. Because before you can measure what a LIMS delivers, you need to understand what the absence of one actually costs.
These costs are real. They just do not show up as line items in a budget.
Manual Rework
When data lives in spreadsheets and paper notebooks, errors are inevitable. Studies across laboratory settings consistently show that labs operating without automated data management spend between 15% and 25% of their total analyst time correcting errors, reconciling results, or re-running tests because the original data was unreliable. In a team of ten analysts working 40-hour weeks, that is anywhere from 600 to 1,000 hours of lost productivity every year.
Compliance Risk
Operating without a LIMS in a regulated environment is not just inefficient — it is genuinely risky. An FDA Form 483 observation related to data integrity or electronic records can trigger a warning letter. A warning letter can trigger a consent decree. The question is not whether your lab will face regulatory scrutiny. The question is whether you will be ready when it happens.
Client Churn
Labs that consistently miss turnaround time commitments lose clients. When clients cannot get reliable answers about sample status, when reports arrive late, when COAs have inconsistencies — they find another lab. The annual revenue impact of client attrition from service quality issues is almost never calculated, but it belongs in the ROI model.
Staff Turnover
Talented scientists do not want to spend their careers doing data entry. Turnover in laboratory settings is expensive — recruitment, onboarding, and lost institutional knowledge routinely costs 50% to 200% of an annual salary per hire.
Instrument Downtime
Without proper scheduling and maintenance tracking, instruments break down unexpectedly. Unplanned downtime costs labs in rescheduled samples, expedited tests, overtime hours, and client compensation. Proactive maintenance scheduling — a standard feature in capable LIMS — reduces unplanned downtime significantly.
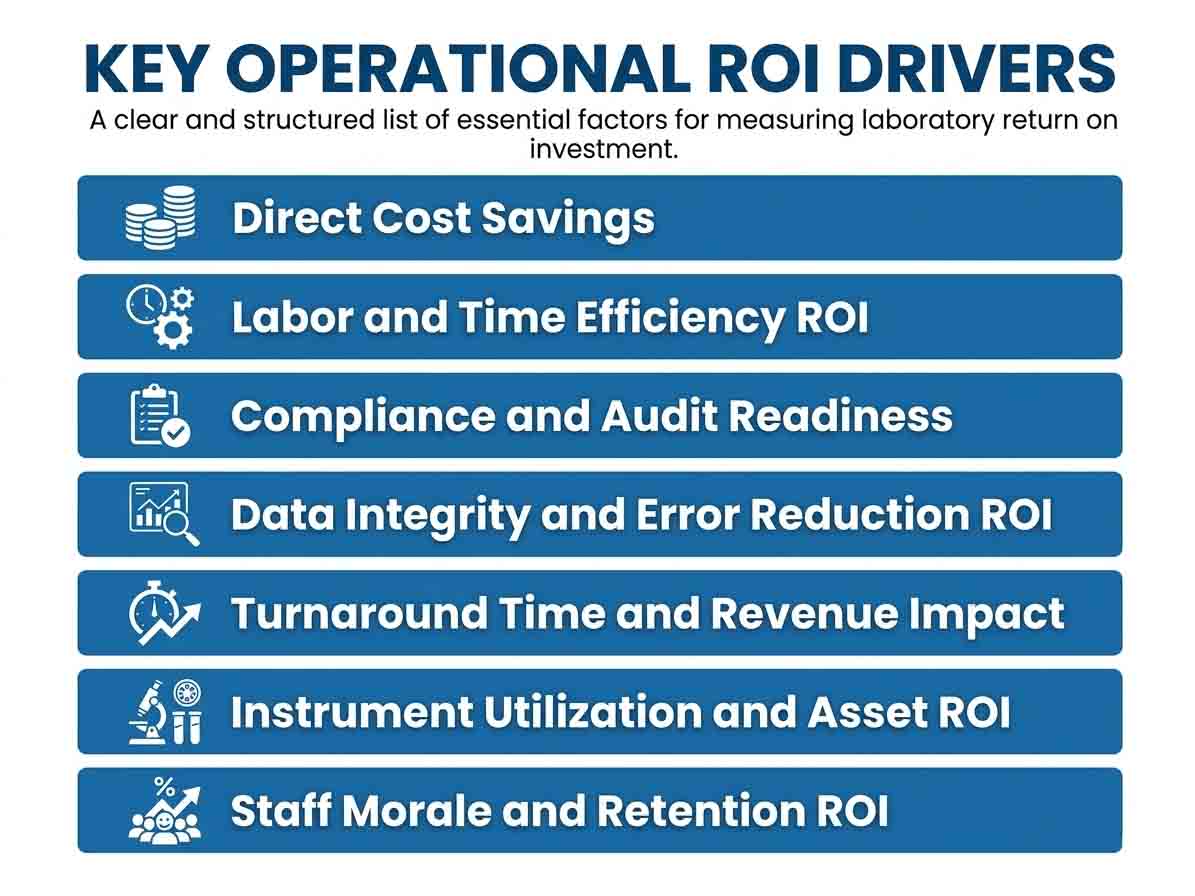
Pillar 1: Direct Cost Savings
Yes, the finance team wants to see hard numbers. So start here — but do not stop here.
Paper and Consumables Reduction
Labs that run paper-based sample tracking systems spend more on paper, printing, filing, and physical storage than they realise. Transitioning to a digital LIMS effectively eliminates this category of expense. Not the biggest number in the model, but the easiest to defend.
Reduced Reagent Waste
When sample management is manual, labs tend to over-order reagents to compensate for uncertainty. A LIMS provides real-time workload visibility that allows procurement to be much tighter. Labs typically report 10% to 20% reductions in reagent spend after LIMS implementation.
Repeat Test Reduction
Manual labs run more repeat tests — either because original data was recorded incorrectly, samples were handled improperly, or results could not be verified. A LIMS with proper sample tracking, chain of custody, and instrument integration eliminates most root causes.
Overtime Reduction
Report generation in a manual lab is a project. In a LIMS-enabled lab, it is a button. Many labs report recovering 4 to 8 hours per analyst per week from report automation alone.
How to calculate your number: Take the number of analysts on your team. Multiply by the average overtime hours per week spent on report preparation. Multiply by your blended hourly rate. Annualise. That is your target.
Pillar 2: Labor and Time Efficiency ROI
Labor is the largest operating cost in most laboratories. It is also where LIMS delivers some of its most significant and measurable returns.
Sample Login and Accessioning
A capable LIMS reduces sample login time by 60% to 80% through barcode scanning, automatic data population, and chain-of-custody logging. For high-volume labs, this alone represents hundreds of hours recovered per year.
Test Assignment and Scheduling
A LIMS automates workload distribution based on predefined rules and real-time instrument status. The scheduling work that used to take an hour in the morning takes minutes.
Result Entry and Review
Direct instrument integration eliminates manual result entry entirely. Results flow from the instrument into the LIMS automatically. The analyst reviews, not transcribes. Small savings per sample — substantial across thousands of samples per month.
Report Generation
Report generation in a manual lab is a project. In a LIMS-enabled lab, it is a button. Certificate of Analysis generation, regulatory submission reports, batch records — all templated, automated, and dispatched with minimal intervention. Labs consistently report 70% to 85% reductions in report preparation time.
Data Retrieval for Audits
When a client or auditor asks for historical data, how long does it take your team to find it? In a manual system, hours — sometimes days. In a LIMS, seconds. Multiply that difference by the number of data requests your lab handles monthly.
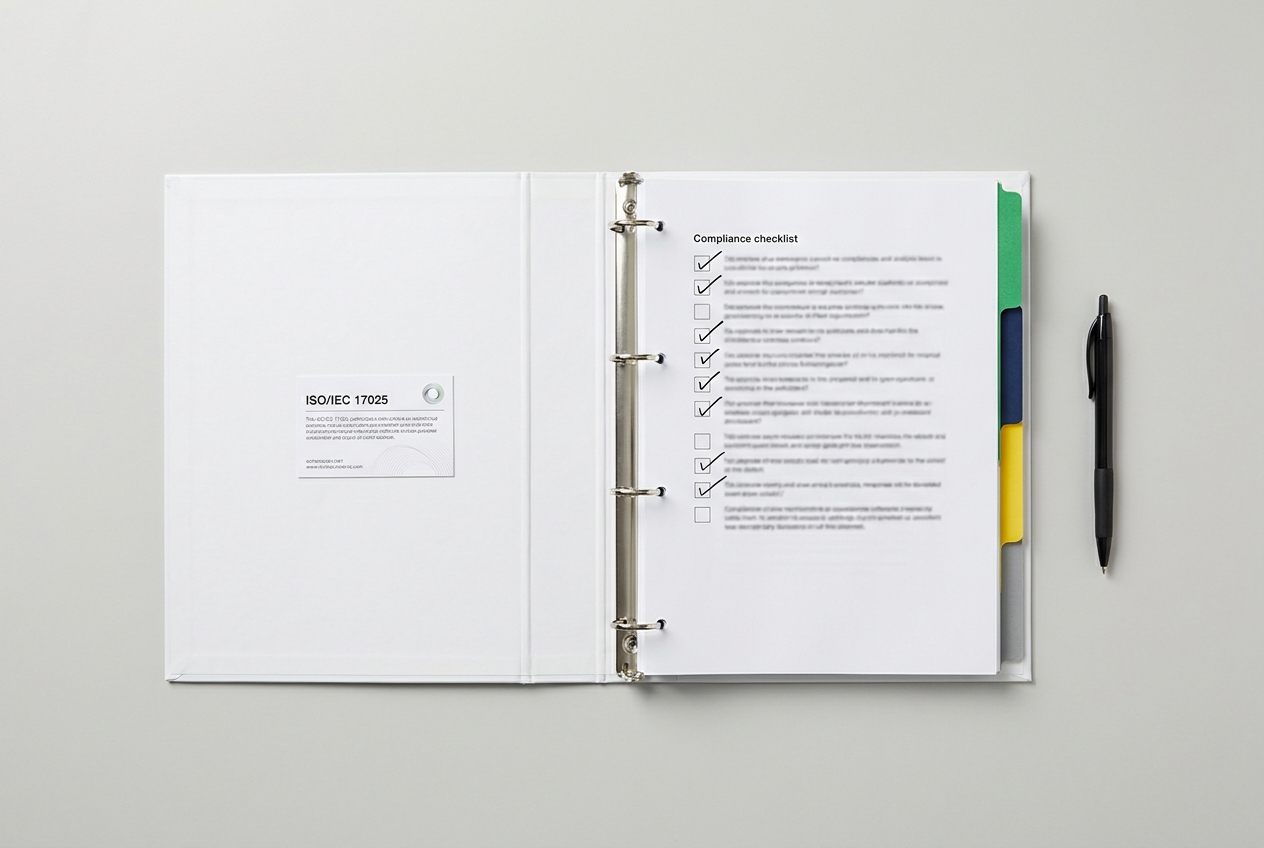
Pillar 3: Compliance and Audit Readiness ROI
This is the pillar that most finance teams underestimate because it is harder to put a number on something that has not happened yet.
The Cost of a Failed Audit
An FDA warning letter does not just create paperwork. It triggers a remediation process that can cost anywhere from $500,000 to several million dollars depending on the scope. It can delay product approvals, freeze manufacturing, damage client relationships, and in serious cases, result in product recalls.
What LIMS Does for Audit Readiness
A well-configured LIMS creates an automatic audit trail for every action — who ran which test, when, on which instrument, using which method version, with what result. It enforces electronic signatures and access controls. It maintains version control on SOPs and test methods. It logs deviations automatically.
The difference between a lab with a proper audit trail and one without is not just efficiency. It is credibility.
ISO 17025 and ISO 21 CFR Part 11
A LIMS built to support ISO 17025 or 21 CFR Part 11 reduces the manual effort required to demonstrate compliance. Calibration records, method validation documents, proficiency test results, staff competency records — all maintained automatically, all available on demand.
How to Quantify It
Look at what similar labs in your sector have paid when audits went poorly. Estimate the probability of a compliance finding given your current documentation practices. Assign a risk-adjusted cost to your current exposure. Even conservative estimates tend to make a strong case.
Pillar 4: Data Integrity and Error Reduction ROI
Data integrity is not a compliance buzzword. It is a fundamental operational requirement, and errors in laboratory data are more expensive than most labs account for.
Studies in laboratory quality management consistently find error rates between 0.5% and 2% in manual data entry environments. For a lab processing 500 samples a day, even a 1% error rate means 5 incorrect results every day that need to be caught, corrected, or — if they are not caught — potentially reported.
A LIMS reduces data integrity risk through several mechanisms that work together:
- Direct instrument integration eliminates transcription errors at the point of result capture
- Automated out-of-specification flagging catches results outside expected ranges before they move forward
- Method and specification locking ensures every test runs against the current version of the correct SOP
- Chain of custody tracking maintains a complete record of sample handling from receipt to disposal
Quantifying this ROI requires your lab's data on repeat testing, investigation time, and client credit or compensation events. Many labs find that error-related costs — when fully accounted for — represent 5% to 10% of total operational costs.
Pillar 5: Turnaround Time and Revenue Impact

Here is where LIMS ROI starts to connect directly to the top line.
Increased Throughput Without Increased Headcount
When the same number of analysts can process more samples per shift — because they are not doing manual data entry, because scheduling is optimised, because report generation takes minutes instead of hours — the lab's revenue capacity increases.
For a lab processing 300 samples per day at an average revenue of $50 per sample, a 15% throughput improvement represents an additional $4,500 per day in revenue capacity. Annualised, that is more than $1 million in additional revenue potential.
Premium Service Tiers
Labs that can reliably offer same-day or next-day turnaround on certain test panels can charge premium rates for rush services. This is only possible when the underlying workflow is efficient enough to actually deliver. A LIMS makes this operationally feasible.
New Client Acquisition
Accreditation bodies, large pharmaceutical clients, and government procurement processes increasingly require evidence of a LIMS. Being able to say "yes, we operate on a validated LIMS" opens doors that are closed to labs running on spreadsheets. This is a real competitive advantage.
Pillar 6: Instrument Utilization and Asset ROI
Laboratory instruments are expensive. A high-performance liquid chromatograph might cost $80,000 to $200,000. A mass spectrometer significantly more. Yet in most labs, these assets are not being utilised anywhere near their potential.
Optimised Scheduling
When sample intake, test requirements, and instrument availability are all visible in a single system, scheduling becomes intelligent. Labs that implement LIMS-based instrument scheduling typically report 20% to 30% improvements in utilisation.
Proactive Maintenance Management
Unplanned instrument downtime is expensive — not just in repair costs, but in rescheduled samples, expedited alternatives, and missed client deadlines. A LIMS that tracks usage hours, calibration cycles, and maintenance intervals generates alerts before problems occur. Planned maintenance costs a fraction of emergency repair.
Calibration Compliance
Running an instrument outside its calibration window is both an operational risk and a regulatory issue. A LIMS automates calibration tracking and prevents the use of instruments that are out of calibration. Results generated on properly calibrated instruments are defensible. Results generated on lapsed instruments are not.
To calculate instrument ROI: Take the replacement cost of your three most critical instruments. Apply a useful life extension of 15% to 20% from proactive maintenance. Calculate the value of that extension. Then add the revenue value of additional throughput from improved utilisation.
Pillar 7: Client Retention and Lab Reputation ROI
Client retention is a financial metric. It just does not always feel like one.
In laboratory services, the cost of acquiring a new client is substantially higher than retaining an existing one. Marketing spend, sales cycles, qualification testing, validation runs, contract negotiation — new client acquisition is expensive and slow.
How LIMS Directly Affects Retention
When clients submit samples, they want to know where those samples are. They want to know when results will be ready. They want confidence that the results they receive are accurate. A LIMS enables client-facing reporting tools, real-time status updates, and consistent report formats that build exactly this kind of confidence.
When something goes wrong — and sometimes things do — a lab with a LIMS can respond faster, explain what happened with documented evidence, and demonstrate corrective action has been taken. That kind of transparent accountability is what retains clients through difficult situations.
The Reputation Multiplier
Laboratory services is a relationship-driven industry. Referrals matter. When a client mentions your lab to a colleague because their experience was consistently excellent, that is effectively free marketing with a much higher conversion rate than any campaign. The inverse is also true — a client who leaves due to service failures rarely goes quietly.
Pillar 8: Staff Morale and Retention ROI
This pillar is the last one in most ROI models, but it arguably should not be.
Replacing a trained analytical chemist or laboratory technician typically costs between $15,000 and $50,000 when you account for recruitment, onboarding, lost productivity during ramp-up, and the institutional knowledge that leaves with the departing employee. Senior staff and specialists cost significantly more to replace.
Here is what consistently drives laboratory turnover: repetitive, low-value work. Data entry. Report formatting. Chasing paper records. These activities do not require the training your staff has. They do not use the skills your staff was hired for. And after a few years of doing them, good people leave.
A LIMS eliminates or dramatically reduces these activities. Analysts spend their time on actual analysis. Scientists spend their time on science. The work becomes more interesting, more meaningful, and more aligned with why these people chose laboratory careers.
How to calculate it: Identify your average annual turnover rate. Estimate how many departures relate to dissatisfaction with repetitive manual work. Apply a conservative retention improvement — even 20% is defensible. Multiply by your per-hire replacement cost. That is your staff retention ROI number.
Building Your ROI Calculator: A Practical Framework
Now that we have covered all eight pillars, here is how to assemble them into a model you can actually use.
Step 1: Establish Your Baseline
Before you can calculate savings or returns, you need to know what you are saving from. Spend two to three weeks documenting the key metrics that matter:
- Average sample login time (in minutes)
- Average report generation time per report
- Hours per week spent on manual data entry
- Current repeat test rate (as % of total tests)
- Average audit preparation time per audit event
- Current client churn rate
- Annual staff turnover rate and cost per hire
- Instrument utilisation rate (% of available hours actually used)
- Annual overtime hours attributable to manual workflow tasks
Step 2: Apply Realistic Improvement Assumptions
Use conservative estimates — this is not the time for optimism. Here are reasonable benchmarks based on typical LIMS implementation outcomes:
| Area of Improvement | Conservative Estimate |
|---|---|
| Manual data entry time | 70–80% reduction |
| Report generation time | 75–85% reduction |
| Repeat test rate | 30–50% reduction |
| Audit preparation time | 60–70% reduction |
| Instrument utilization | 15–25% improvement |
| Staff overtime (report-related) | 50–65% reduction |
Step 3: Calculate the Financial Value of Each Improvement
For each improvement, multiply the time saved by the fully-loaded hourly cost of the relevant staff category. For revenue impact, use your lab's actual revenue-per-sample and throughput data.
Step 4: Project Over a Three-Year Period
LIMS ROI builds over time. Year one is typically break-even or modest positive. Year two and three show compounding returns as the system is fully embedded and efficiency gains are operating at full scale. A three-year projection almost always shows a substantially better return than a one-year view.
Step 5: Separate Hard from Soft ROI
Hard ROI: Direct cost reductions, overtime savings, repeat test reduction. These are defensible with numbers. Soft ROI: Client retention improvement, staff morale, reputation. Real, but harder to quantify precisely. Present them separately and give them a conservative dollar value.
Industry-Specific ROI Benchmarks
LIMS ROI looks different depending on what kind of lab you are running. Here are the areas where ROI tends to be highest across the industries Revol LIMS serves.
Pharmaceutical and Biotech Labs
The dominant ROI driver is regulatory compliance. The cost of a batch release failure, an FDA Form 483, or a recall in pharmaceutical manufacturing can run into the tens of millions. A properly validated LIMS with 21 CFR Part 11 compliance dramatically reduces these risks.
Food and Beverage Labs
Turnaround time is the primary ROI driver in food safety testing. When a food manufacturer is waiting for microbiological results before releasing a product shipment, every hour of testing time has a dollar value. Labs that deliver faster results command premium pricing and retain high-volume clients.
Environmental and Water Testing Labs
Regulatory submission timeliness is critical. Environmental labs face strict deadlines for regulatory reporting — missing them can result in contract penalties or accreditation issues. A LIMS that automates report generation reduces the risk of deadline failures.
Clinical and Diagnostic Labs
Patient result turnaround time directly affects both clinical outcomes and lab reputation. Billing accuracy — ensuring that every test performed is captured and charged correctly — is an often-overlooked LIMS benefit that can add significant revenue recovery.
Petrochemical and Oil and Gas Labs
Instrument uptime and utilisation dominate the ROI conversation. When a laboratory instrument failure delays a product quality release in a petrochemical facility, the cost is not just the repair — it is the downstream production impact.
When to Expect Returns: The LIMS ROI Timeline
One of the questions that comes up in almost every LIMS budget conversation is: "When will we see the payback?"
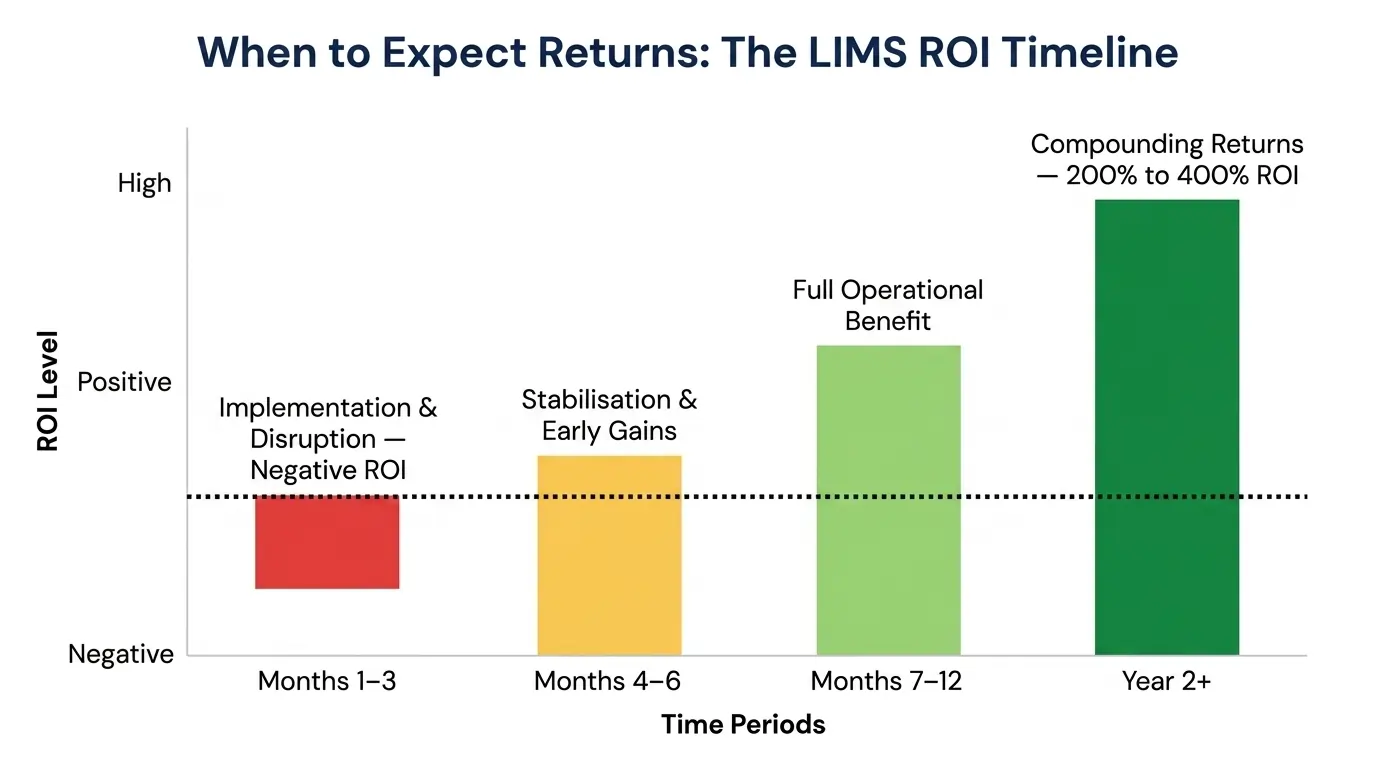
Months 1–3: Implementation and Disruption
This is the hardest phase. Workflows are being changed. Staff are learning a new system. Some processes slow down temporarily before they speed up. ROI during this phase is negative — you are incurring implementation costs and absorbing the productivity impact of transition. This is normal and expected.
Months 4–6: Stabilisation and Early Gains
By month four, most labs are operating the new system competently. The early wins — faster report generation, eliminated data entry, automated scheduling — begin to show up in measurable ways. Staff are spending less time on manual tasks. Overtime starts to decrease.
Months 7–12: Full Operational Benefit
By month seven to twelve, the LIMS is embedded in daily operations. The efficiency gains are running at scale. The compliance infrastructure is in place and tested. This is where the ROI model starts to prove itself against the original projections.
Year 2 and Beyond: Compounding Returns
In year two, the benefits compound. New features are deployed. Staff find additional workflow efficiencies. The data accumulated in the LIMS begins to enable better decisions — instrument replacement planning, test method optimisation, staffing adjustments based on actual workload data.
How to Present the ROI Case to Management
You have done the analysis. You have built the model. Now you need to get it approved.
What Does Not Work
A dense spreadsheet with dozens of assumptions and a bottom-line number that looks too good to be true. Finance teams have seen optimistic projections before. If your model is too clean, it will be questioned into irrelevance.
What Works
A structured narrative that separates what you know from what you estimate, uses conservative numbers, acknowledges uncertainty where it exists, and presents the decision in terms of risk as well as return.
Start with the status quo. Not "here is why we need a LIMS" — that is a product pitch. Instead: "Here is what our current operations cost us, here is what our compliance exposure looks like, and here is where our competitive position is headed if we do not change." Let the baseline tell the story.
Then introduce the ROI model — not as a promise, but as a projection. Show the three-year view. Show the break-even point. Show what happens if you hit only 60% of your projected gains.
Address the risks proactively. Implementation disruption is real — acknowledge it and show how you will manage it.
Then close with the risk of inaction. The compliance exposure. The competitive disadvantage. The staff retention pressure. The client satisfaction risk. Inaction is a choice that has its own cost — because it does.
Conclusion: ROI Is Not a Number — It Is a Decision Framework
Every lab that has gone through a LIMS evaluation has faced the same moment: sitting in a budget meeting trying to justify an investment that delivers value in ways that do not fit neatly into a spreadsheet.
A LIMS is not a cost-reduction tool. It is an operational foundation that makes your lab safer, faster, more compliant, more competitive, and more capable of growth. The cost savings are real — but they are the floor of the value story, not the ceiling.
When you calculate LIMS ROI across all eight pillars — direct savings, labor efficiency, compliance risk reduction, data integrity, revenue capacity, asset utilisation, client retention, and staff retention — the case for investment is almost always compelling.


 (1) (1).webp)

.webp)