Laboratories are increasingly becoming data-driven environments. The sheer volume of data generated in modern labs—ranging from test results to sample tracking and equipment performance metrics—requires more than just traditional data management systems. This is where advanced analytics and data visualization in LIMS (Laboratory Information Management Systems) comes into play. These tools are revolutionizing the way laboratories operate, allowing lab managers and researchers to not only collect and store data but also to analyze, visualize, and act on it in real-time.
Let’s dive into what advanced analytics and data visualization are, why they are so important for labs, and how they are transforming laboratory management.
What is Advanced Analytics & Data Visualization in LIMS?
Advanced analytics refers to a set of data analysis techniques that go beyond basic reporting. This can include predictive analytics , trend analysis , and other sophisticated methods that provide actionable insights and forecasts based on historical and real-time data. These tools help identify patterns, anomalies, and trends that may not be immediately apparent in raw data.
Data visualization takes this a step further by turning complex datasets into visually engaging, easy-to-understand reports and dashboards. With charts, graphs, heat maps, and other visual representations, lab personnel can quickly grasp key insights, identify trends, and make data-driven decisions.
In the context of LIMS , advanced analytics and data visualization tools work together to help labs:
- Analyze and interpret data in real-time.
- Visualize trends, patterns, and anomalies
- Make informed, data-driven decisions that improve operational efficiency.
Why Are Advanced Analytics & Data Visualization Important for Labs?
Advanced analytics and data visualization are not just nice-to-have features—they are essential for optimizing laboratory operations, improving decision-making, and enhancing overall lab performance. Here’s why they are becoming critical components of modern LIMS:
1. Optimizing Laboratory Operations LIMS platforms are designed to help labs manage their processes, from sample tracking to data collection and reporting. However, the true potential of these systems is unlocked when advanced analytics tools are incorporated.
With predictive analytics, lab managers can forecast future trends, identify potential bottlenecks, and optimize resource allocation. For example:
- Predicting sample volumes based on past trends, so labs can anticipate demand for storage or testing equipment.
- Analyzing historical data to predict equipment maintenance needs, ensuring that machines don’t unexpectedly break down and disrupt lab operations.
- Using predictive models to optimize workflows, ensuring that the most critical tests and tasks are prioritized, leading to improved turnaround times and better resource management
By analyzing data in real-time and visualizing it in an accessible format, labs can continuously improve their operations and respond quickly to changes in demand or equipment status.
2. Enhancing Decision-Making with Predictive Insights
Decision-making in the lab often requires more than just reacting to current data. In many cases, lab managers need to anticipate future outcomes to make proactive decisions.
Predictive analytics in LIMS allows labs to forecast future trends based on historical data. For example:
- Trend Analysis: By examining historical trends in test results, lab managers can identify patterns in sample outcomes. This is especially helpful in fields like pharmaceuticals, where understanding long-term trends can inform product development or clinical trial decisions.
- Risk Management: Predictive analytics can highlight potential risks before they become problems. For instance, if a particular piece of lab equipment shows signs of wear and tear, predictive models can forecast when it will need maintenance, preventing unexpected failures.
- Demand Forecasting: Advanced analytics can help labs predict which tests or services will be in high demand at certain times, allowing labs to better prepare and allocate resources, reducing delays or downtime.
By equipping labs with these predictive insights, advanced analytics help decision-makers not only respond to issues but also act proactively to mitigate them before they impact the lab’s performance.
3. Simplifying Complex Data Through Visualization
Laboratory data can often be complex and difficult to interpret without the right tools. With advanced data visualization, LIMS platforms transform this complexity into clear, digestible visual reports that help lab personnel make sense of the data more easily.
Some benefits of data visualization include:
- Quick Data Interpretation: Lab managers and staff can quickly grasp key insights by looking at visual reports, rather than sifting through raw data. For example, a trend graph can show the rate of sample processing over time, highlighting any slowdowns or inefficiencies that need attention.
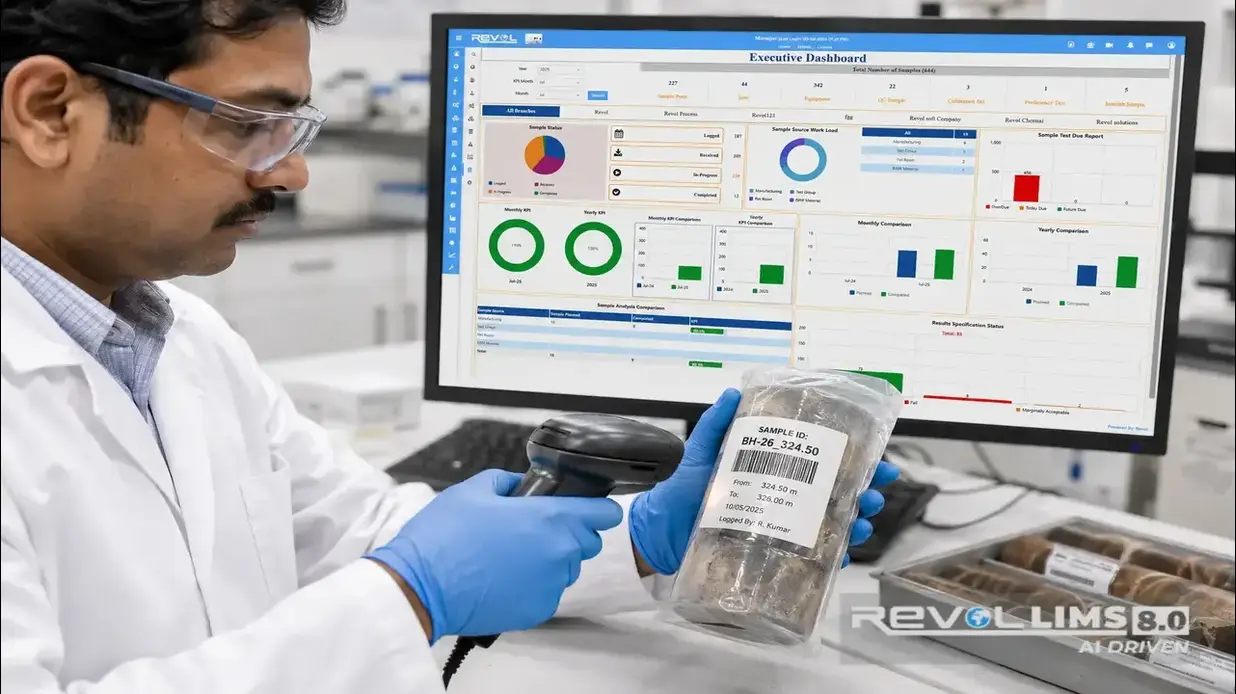
- Customizable Dashboards: Many LIMS platforms allow users to customize dashboards to display the most relevant data. Whether it's the number of active samples, upcoming maintenance schedules, or test results, a well-designed dashboard helps lab staff stay focused on what matters most.
- Visualizing Trends and Patterns: Data visualization helps to uncover trends that might be hard to spot in raw numbers. For example, heatmaps can show areas of the lab that are experiencing higher-than-usual temperatures, or line graphs can track the performance of lab instruments over time, indicating when calibration is needed.
By simplifying complex data through charts, graphs, and other visuals, labs are empowered to make faster, more informed decisions, improving their overall efficiency and productivity.
4. Improving Quality Control and Compliance
In regulated industries, such as pharmaceuticals and clinical research, strict quality control is essential. Advanced analytics can play a crucial role in maintaining high-quality standards by enabling real-time monitoring of lab processes and test results.
For example, LIMS with advanced analytics can:
- Monitor Test Variability: Trend analysis can help identify any outliers or irregularities in test results, triggering quality control checks before the results are finalized or published.
- Ensure Compliance: By visualizing compliance-related metrics (such as temperature data for sensitive samples), labs can ensure they are meeting regulatory requirements without having to manually comb through records. Dashboards can highlight compliance status at a glance, making it easier for lab managers to stay on top of regulations.
- Reduce Human Error: Automation of data analysis through advanced analytics helps reduce the chances of human error. If a test result falls outside the expected range, the system can automatically flag the data and notify the relevant personnel, ensuring that issues are caught early.
By leveraging advanced analytics and visualization tools, labs can maintain high-quality standards, improve consistency in results, and meet regulatory requirements with greater ease.
5. Facilitating Collaboration and Reporting
With data visualization tools, labs can share findings and insights more effectively with stakeholders. Whether it’s a research team, management, or regulatory bodies, the ability to communicate complex data clearly is vital. Visual reports and dashboards make it easier to present data in a way that everyone can understand, promoting collaboration and transparency.
For example:
- Sharing Trends and Insights: Researchers or managers can present data to stakeholders in a visually engaging way, making it easier to convey key insights and make data-driven decisions collaboratively.
- Reporting Compliance Data: Regulatory agencies often require detailed reports on lab activities and results. With data visualization, these reports can be automated and generated in a format that is clear, concise, and easily understandable by non-technical audiences.
Conclusion
In today’s data-driven world, the integration of advanced analytics and data visualization in LIMS is transforming the way laboratories operate. By converting complex data into easily understandable visual reports and providing predictive insights, these tools are helping labs optimize their workflows, improve decision-making, and enhance overall lab performance.
With the ability to analyze trends, forecast future outcomes, and visualize data in real-time, labs can not only respond to issues more quickly but also anticipate them before they arise. As the demand for data-driven insights grows, the role of advanced analytics and data visualization in laboratories will continue to evolve, driving operational efficiencies and enabling labs to stay ahead in a competitive, data-intensive landscape.
The future of laboratory management is clearer, smarter, and more informed—thanks to the power of advanced analytics and data visualization.